
Help
About Market News
Portal Help
Graphing
Dairy custom reports can be graphed by selecting the graph icon on a custom report results page.
![]()
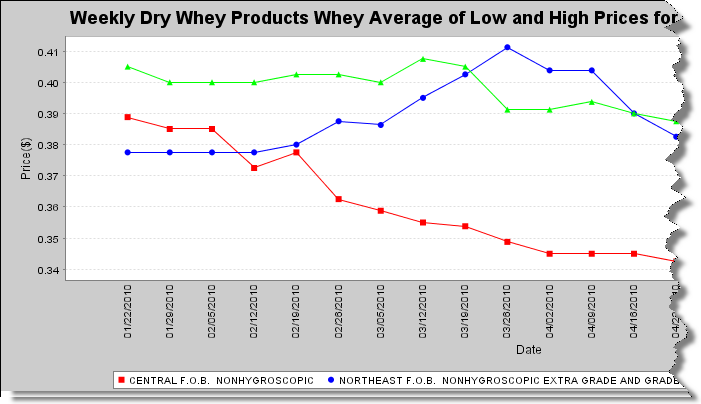
Any data series on a report can be graphed together allowing for comparisons of data series. To graph multiple data series, select multiple graph lines and select Submit to update the graph. Some reports also have more than one price point, for example Average Price or Average Mostly Price. Weekly graphs can be viewed by report date or week number. Also, registered users can save a shortcut to a graph to their home page.
Bookmark a graph by logging into the portal, navigating to the desired graph, and clicking "Save Graph to My Favorites ". You may also download, save, and view an image of this graph by clicking "Download Graph". This image can then be imported into a document or shared in an email.